Resources by region
Click on the map to find out more about the activities and resources in that region.
| Prototype | Tumetoka Mbali | ||
| Usichukulie Poa | Siri ya Ushindi |
Close

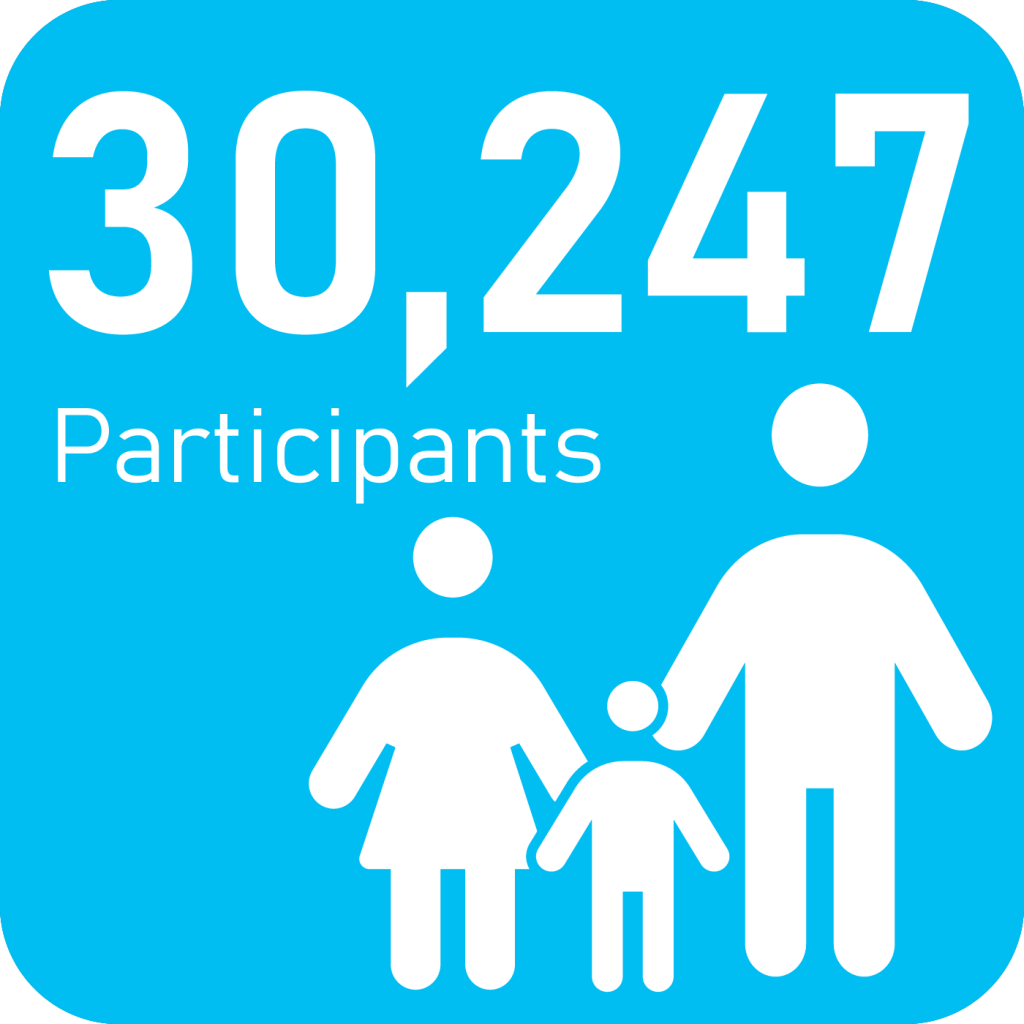
Dodoma
Percentage of improved toilets
2017
31%
2018
41%
2019
58%
2020
58%
2021
62%
Number of events and attendance


Close

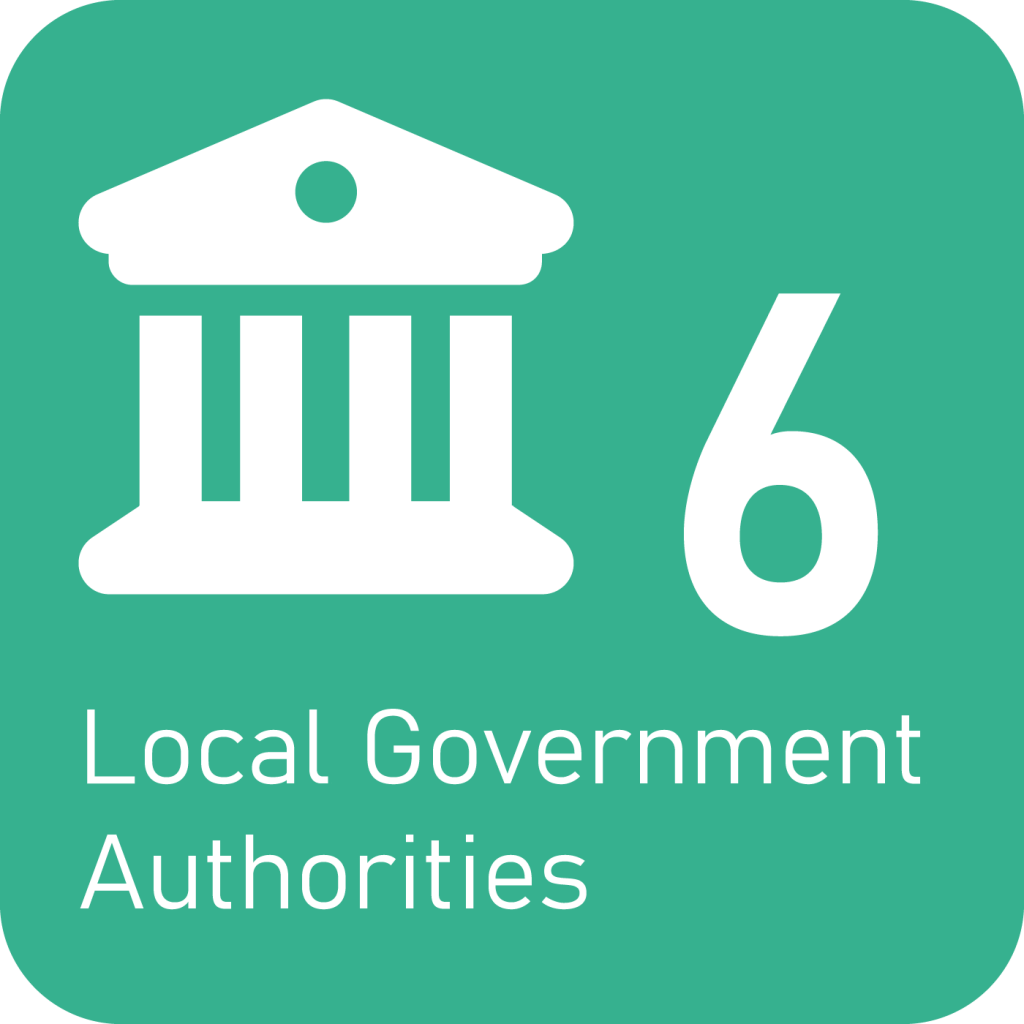
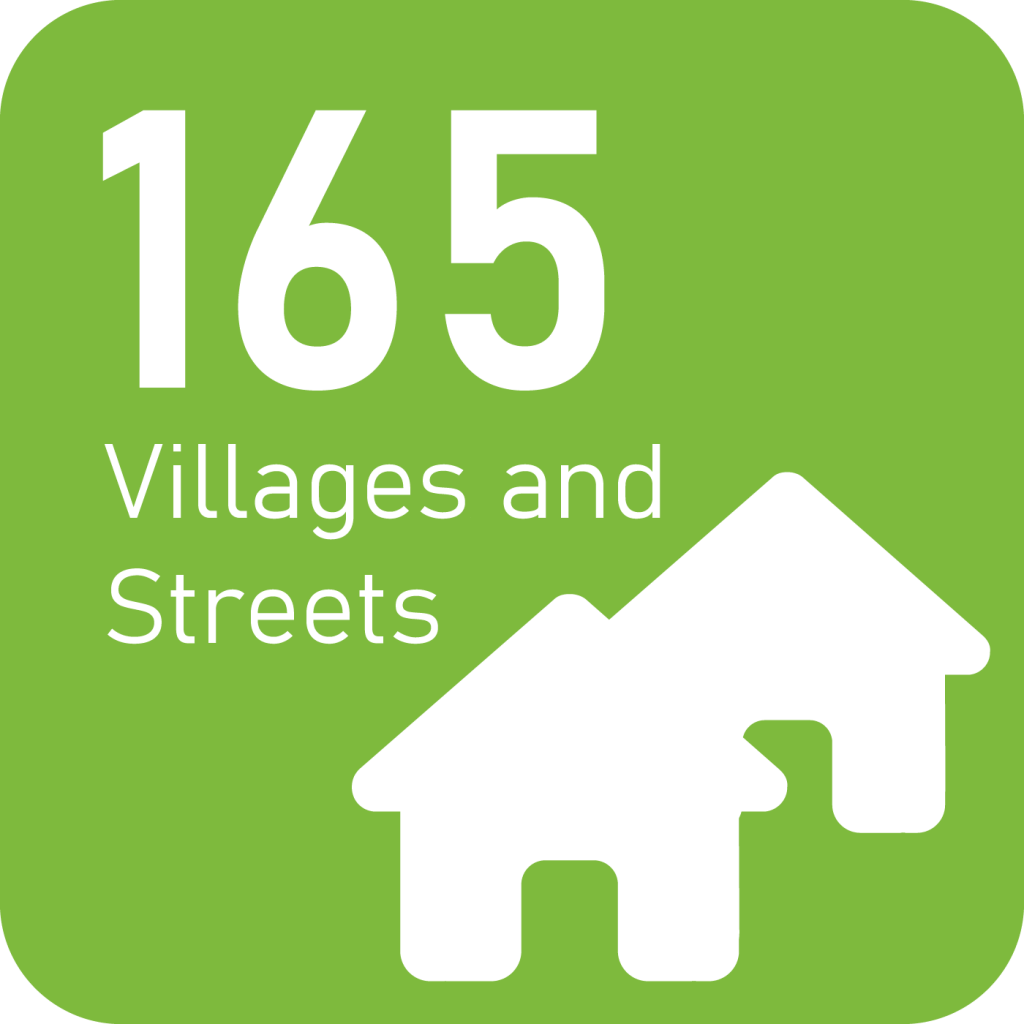
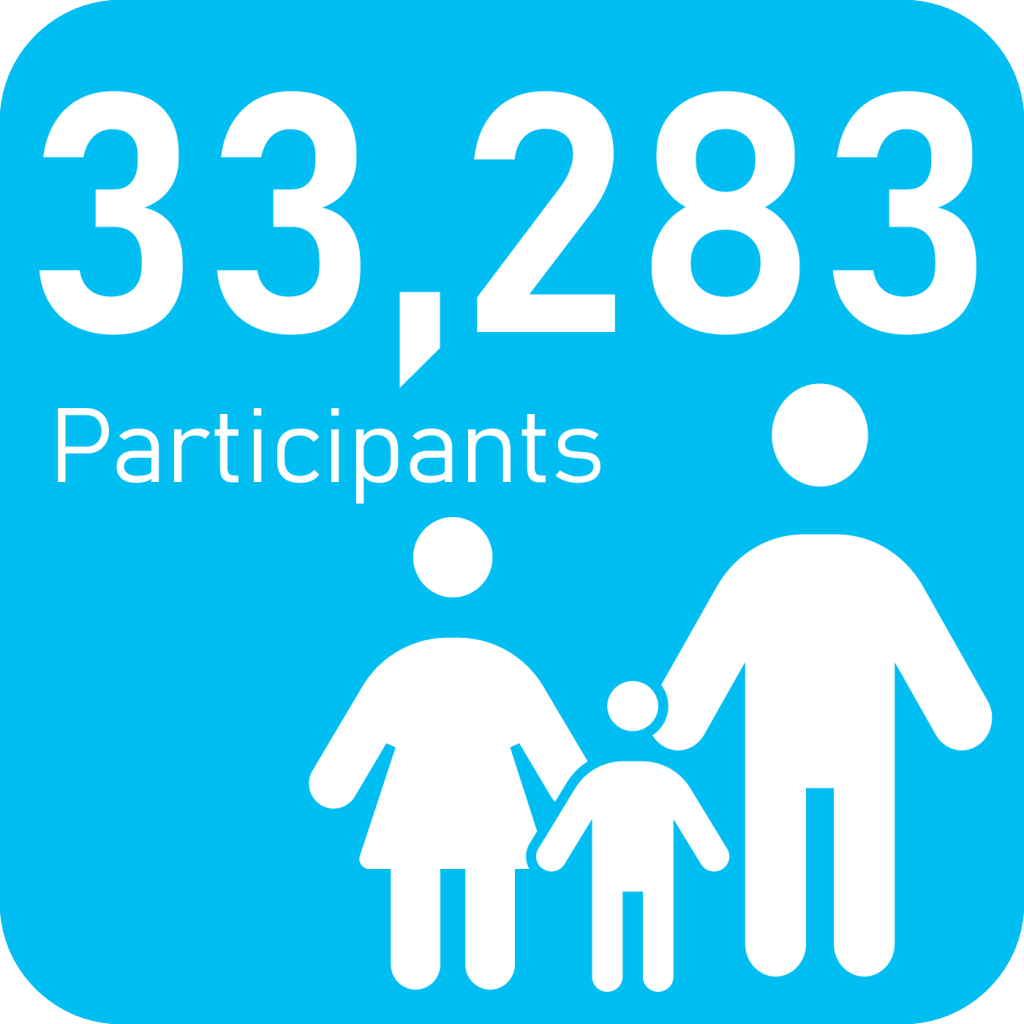
Geita
Percentage of improved toilets
2017
44%
2018
46%
2019
55%
2020
60%
2021
71%
Number of events and attendance


Close

Kagera
Percentage of improved toilets
2017
31%
2018
48%
2019
58%
2020
58%
2021
62%
Number of events and attendance


Close

Katavi
Percentage of improved toilets
2017
54%
2018
62%
2019
66%
2020
73%
2021
77%
Number of events and attendance


Close

Kigoma
Percentage of improved toilets
2017
27%
2018
32%
2019
37%
2020
48%
2021
53%
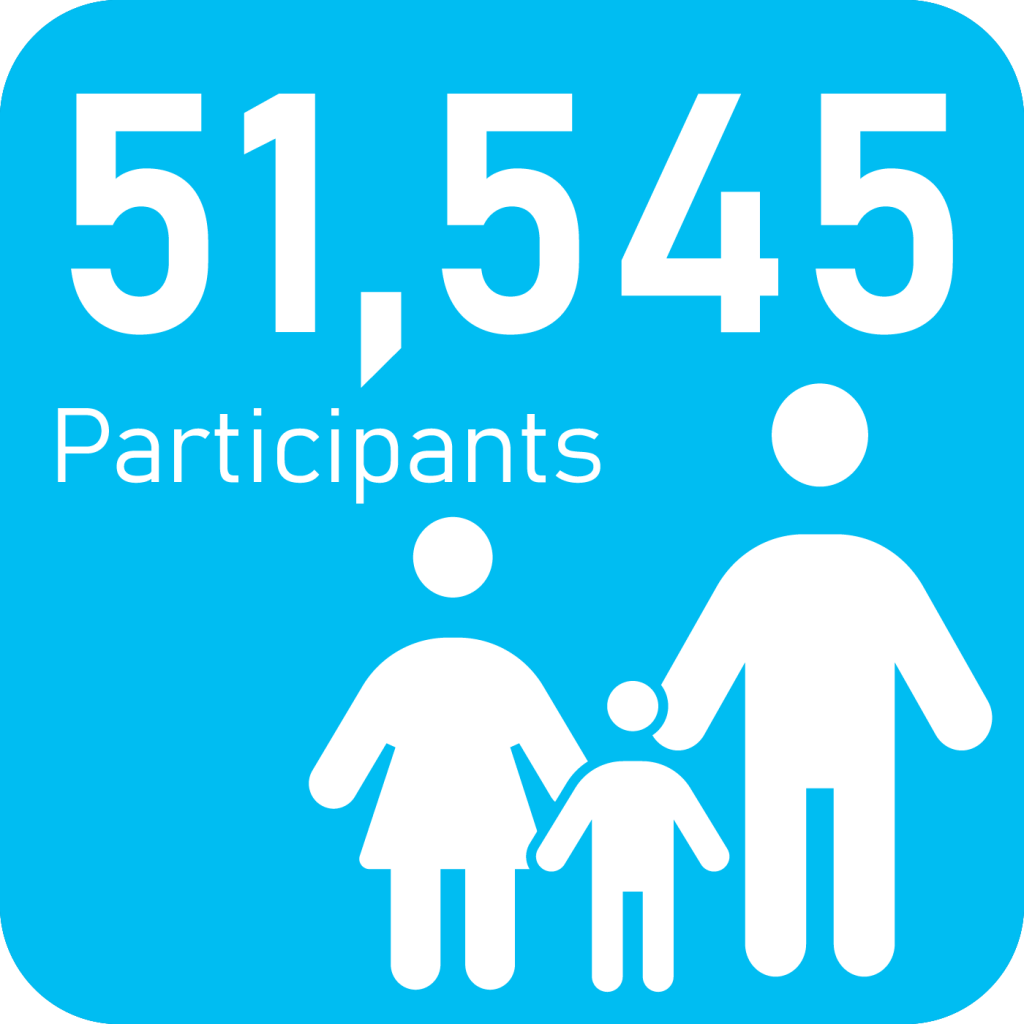
Number of events and attendance


Close

Mara
Percentage of improved toilets
2017
41%
2018
39%
2019
51%
2020
57%
2021
59%
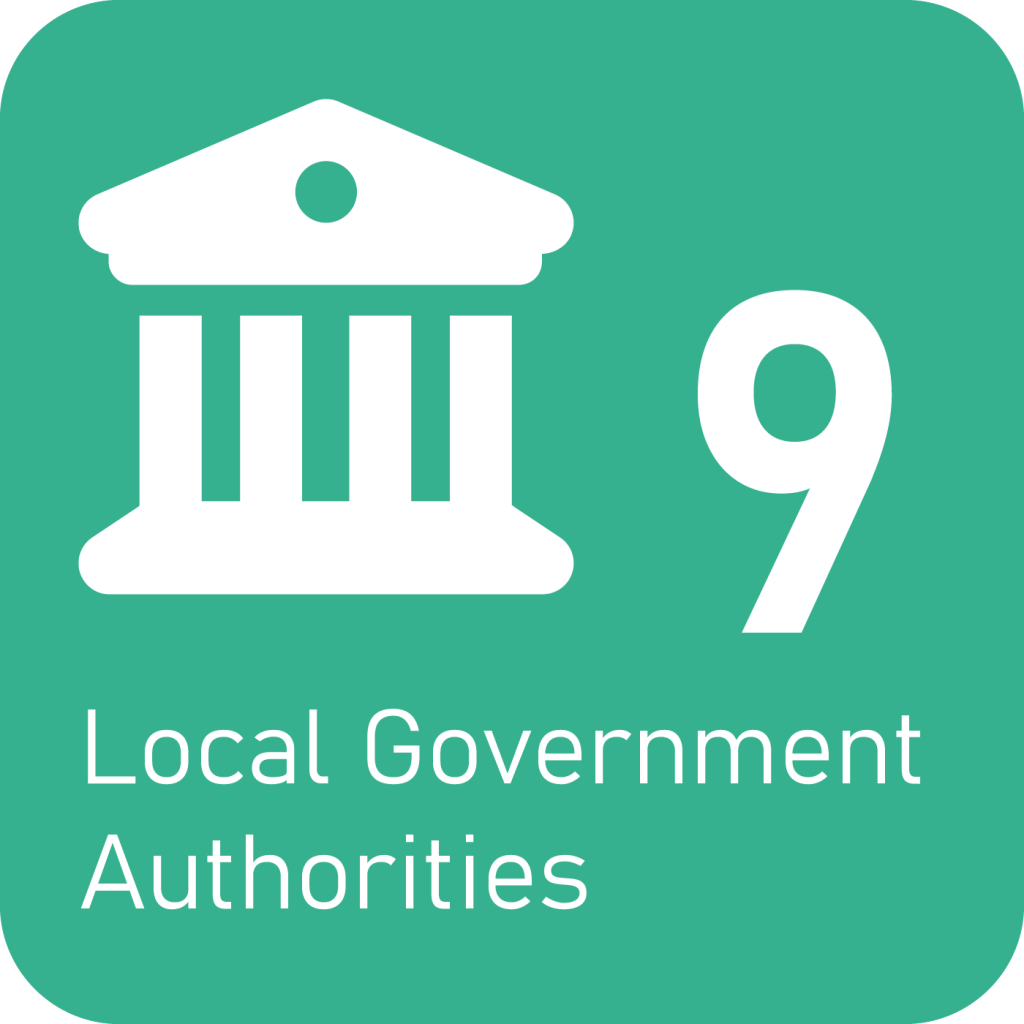
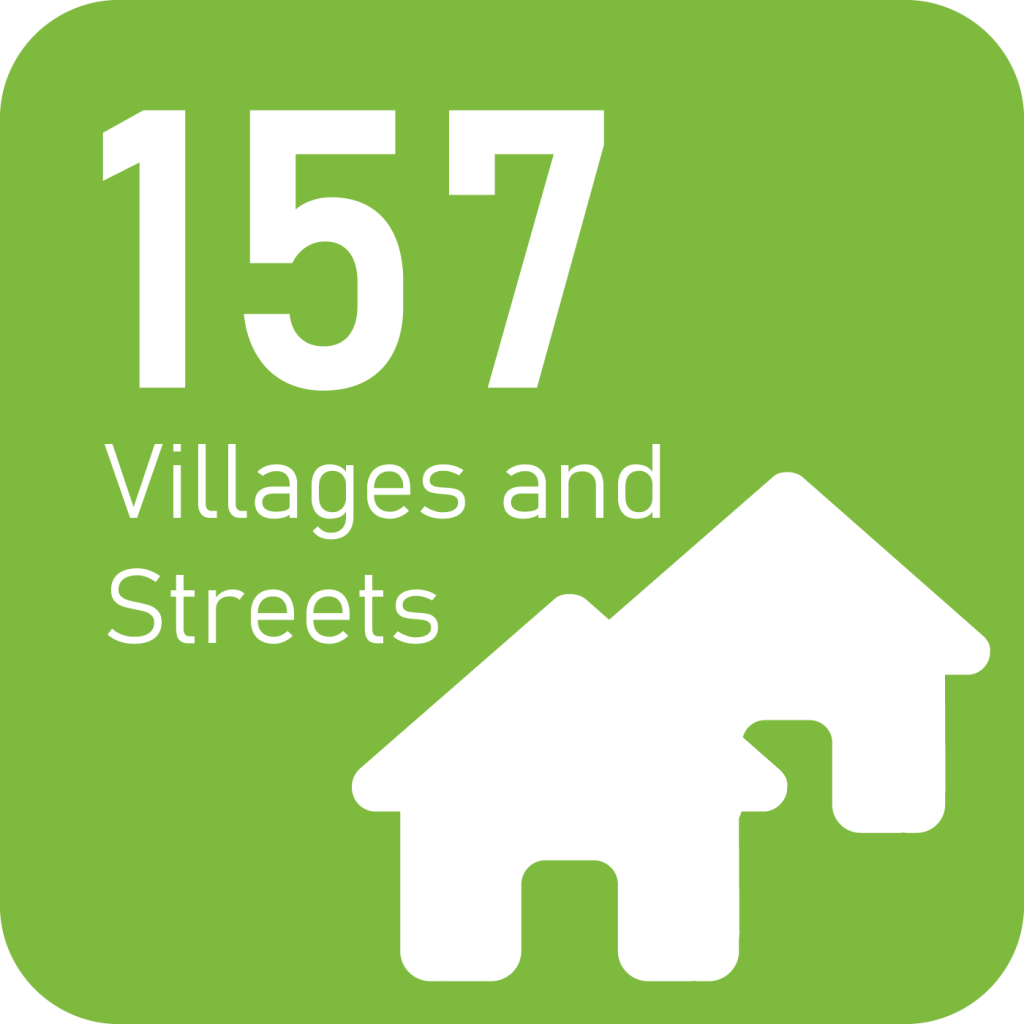
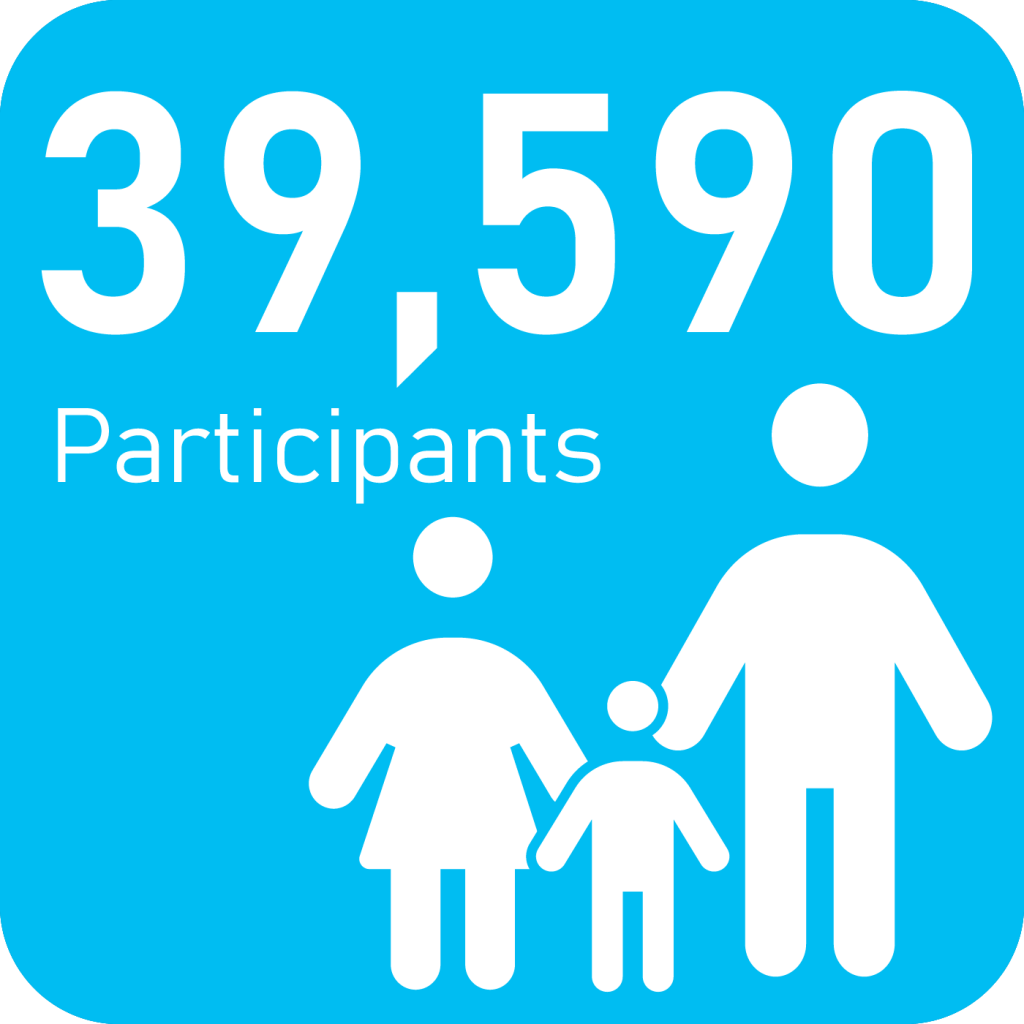
Number of events and attendance


Close

Mbeya
Percentage of improved toilets
2017
52%
2018
61%
2019
67%
2020
74%
2021
73%
Number of events and attendance


Close

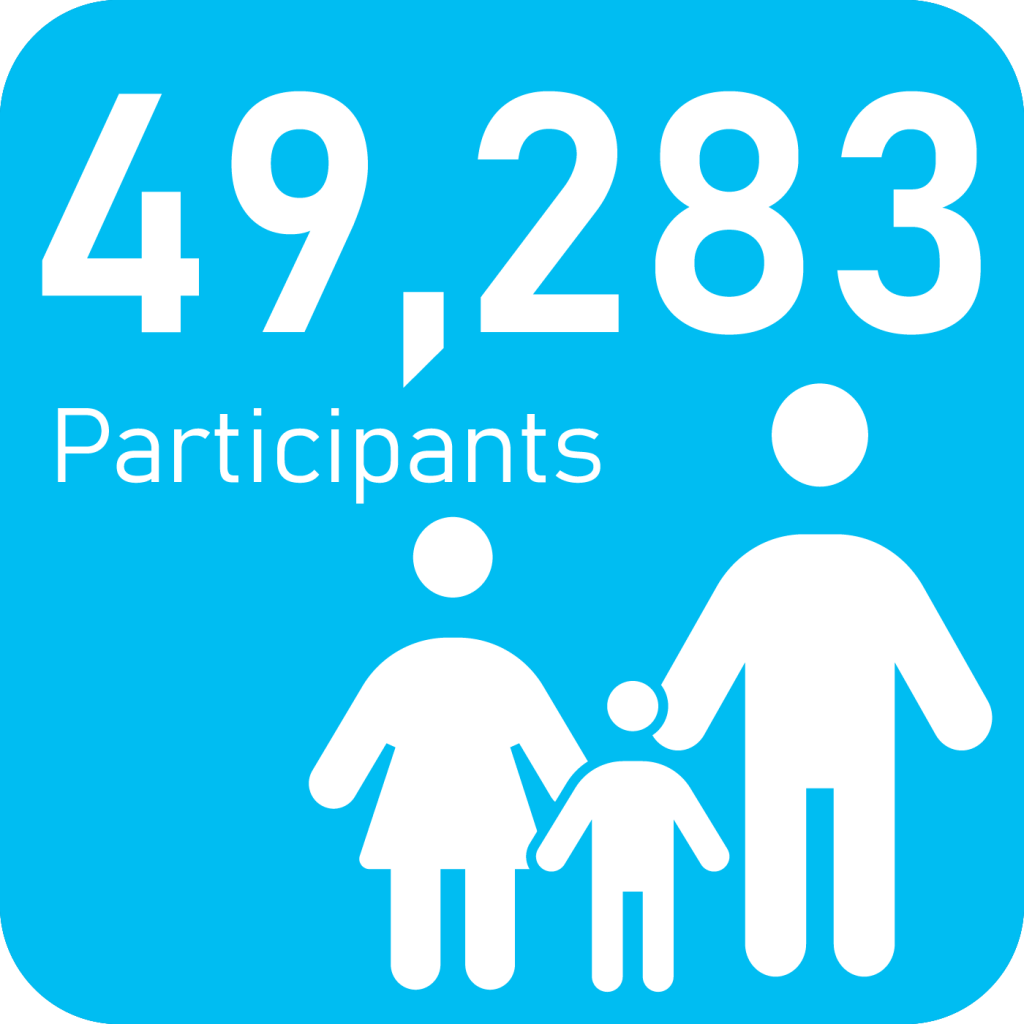
Morogoro
Percentage of improved toilets
2017
49%
2018
47%
2019
57%
2020
65%
2021
70%
Number of events and attendance


Close

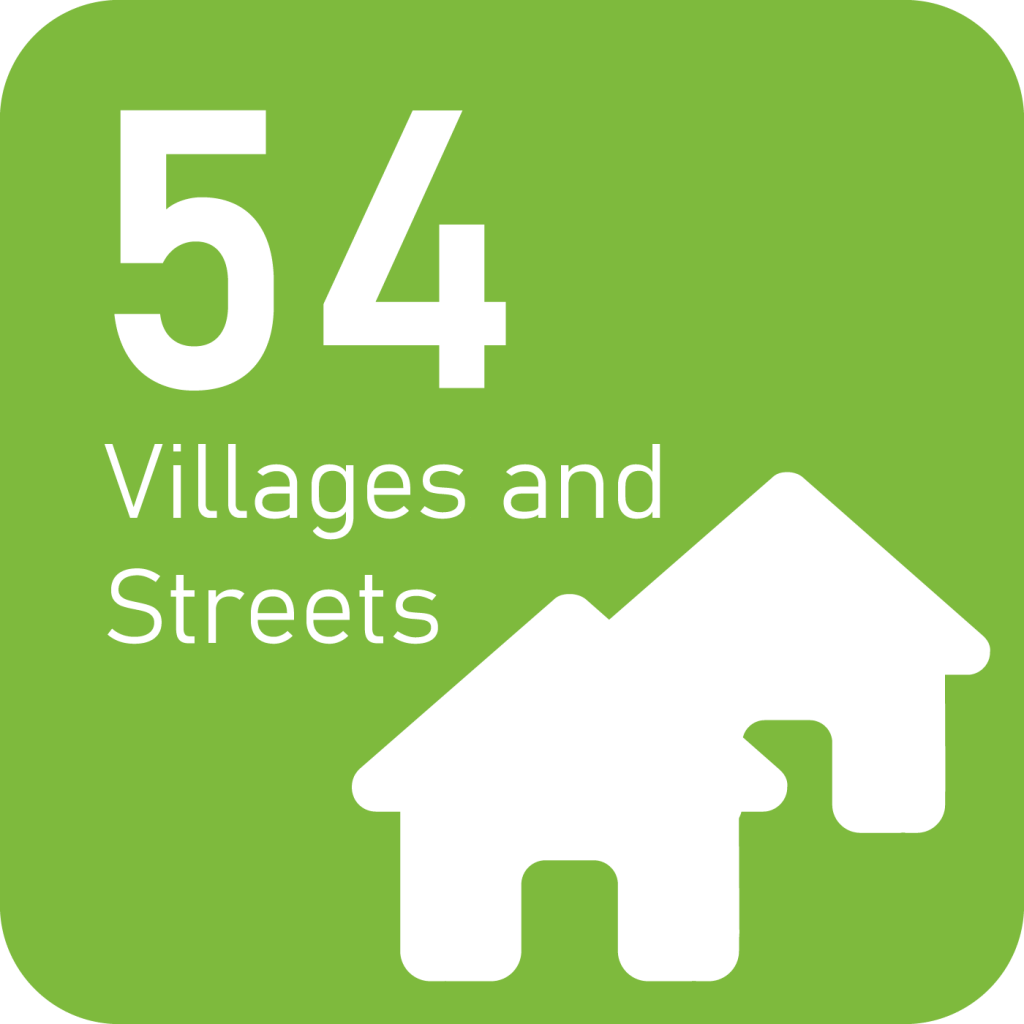
Mtwara
Percentage of improved toilets
2017
30%
2018
42%
2019
54%
2020
51%
2021
55%
Number of events and attendance


Close

Mwanza
Percentage of improved toilets
2017
42%
2018
44%
2019
45%
2020
64%
2021
75%
Number of events and attendance


Close

Rukwa
Percentage of improved toilets
2017
40%
2018
54%
2019
58%
2020
61%
2021
60%
Number of events and attendance


Close

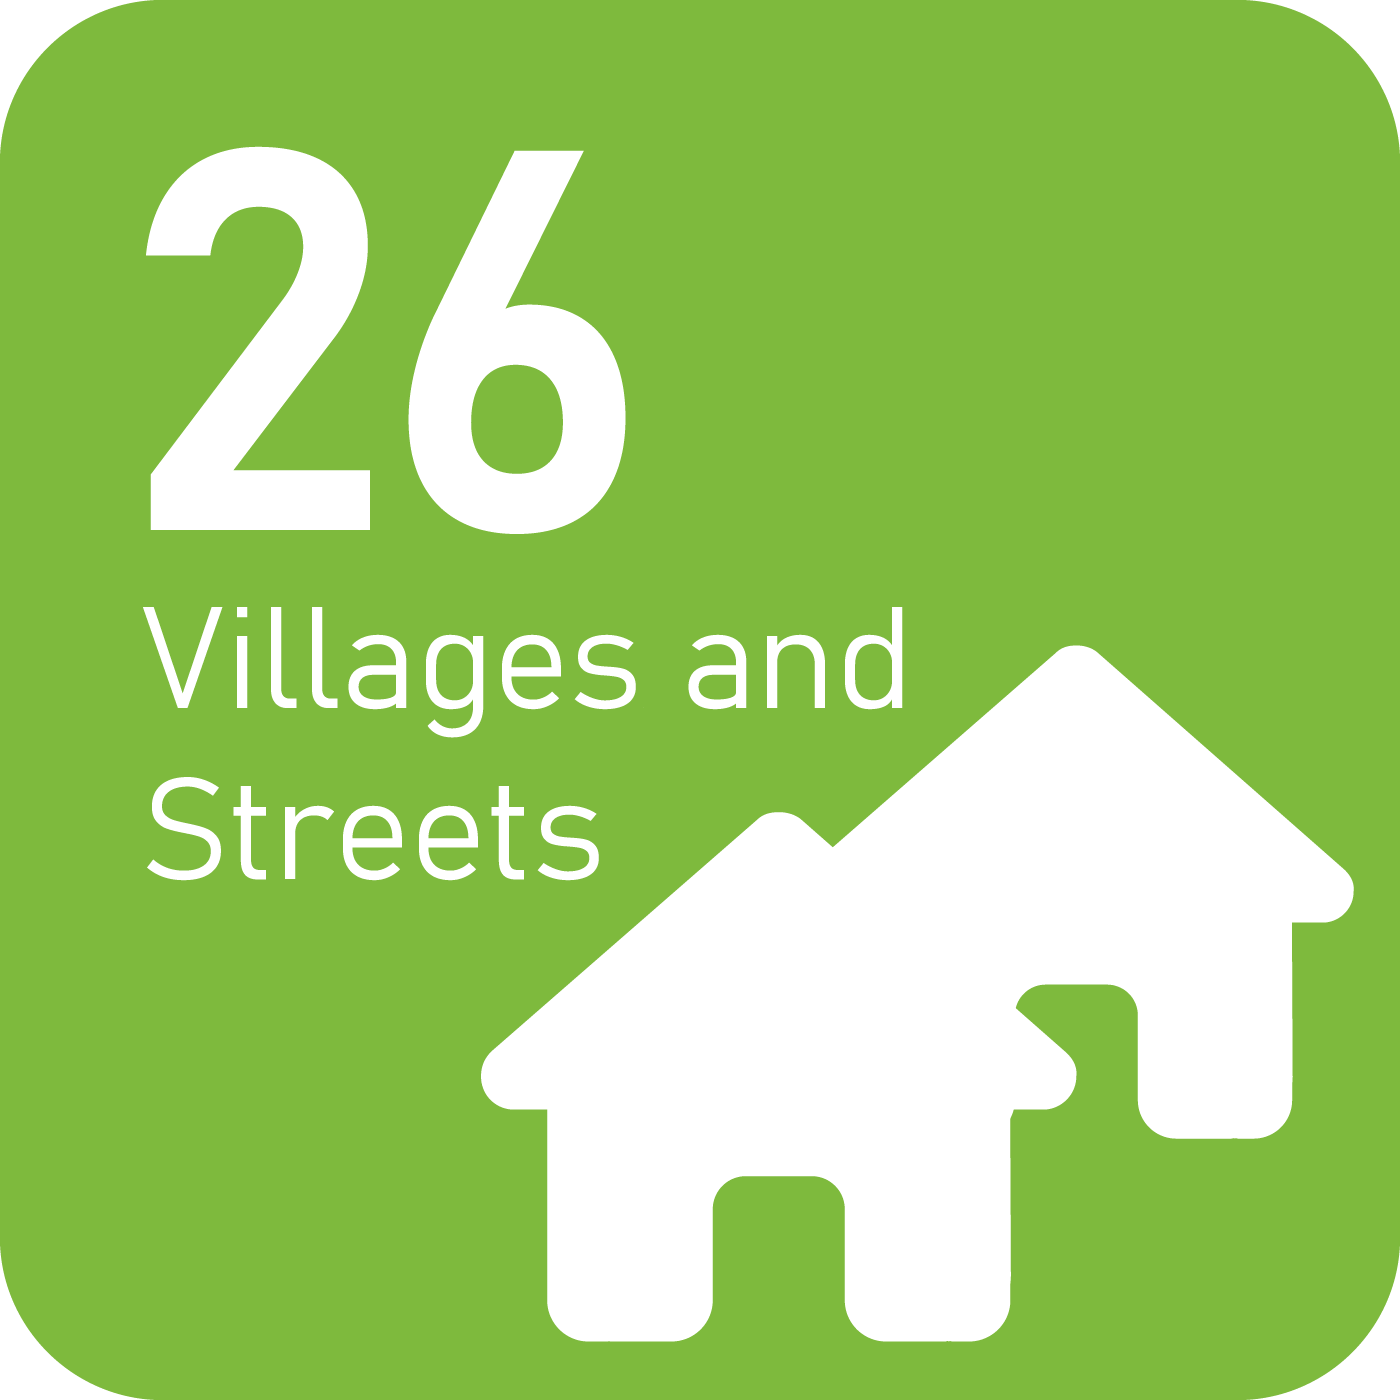
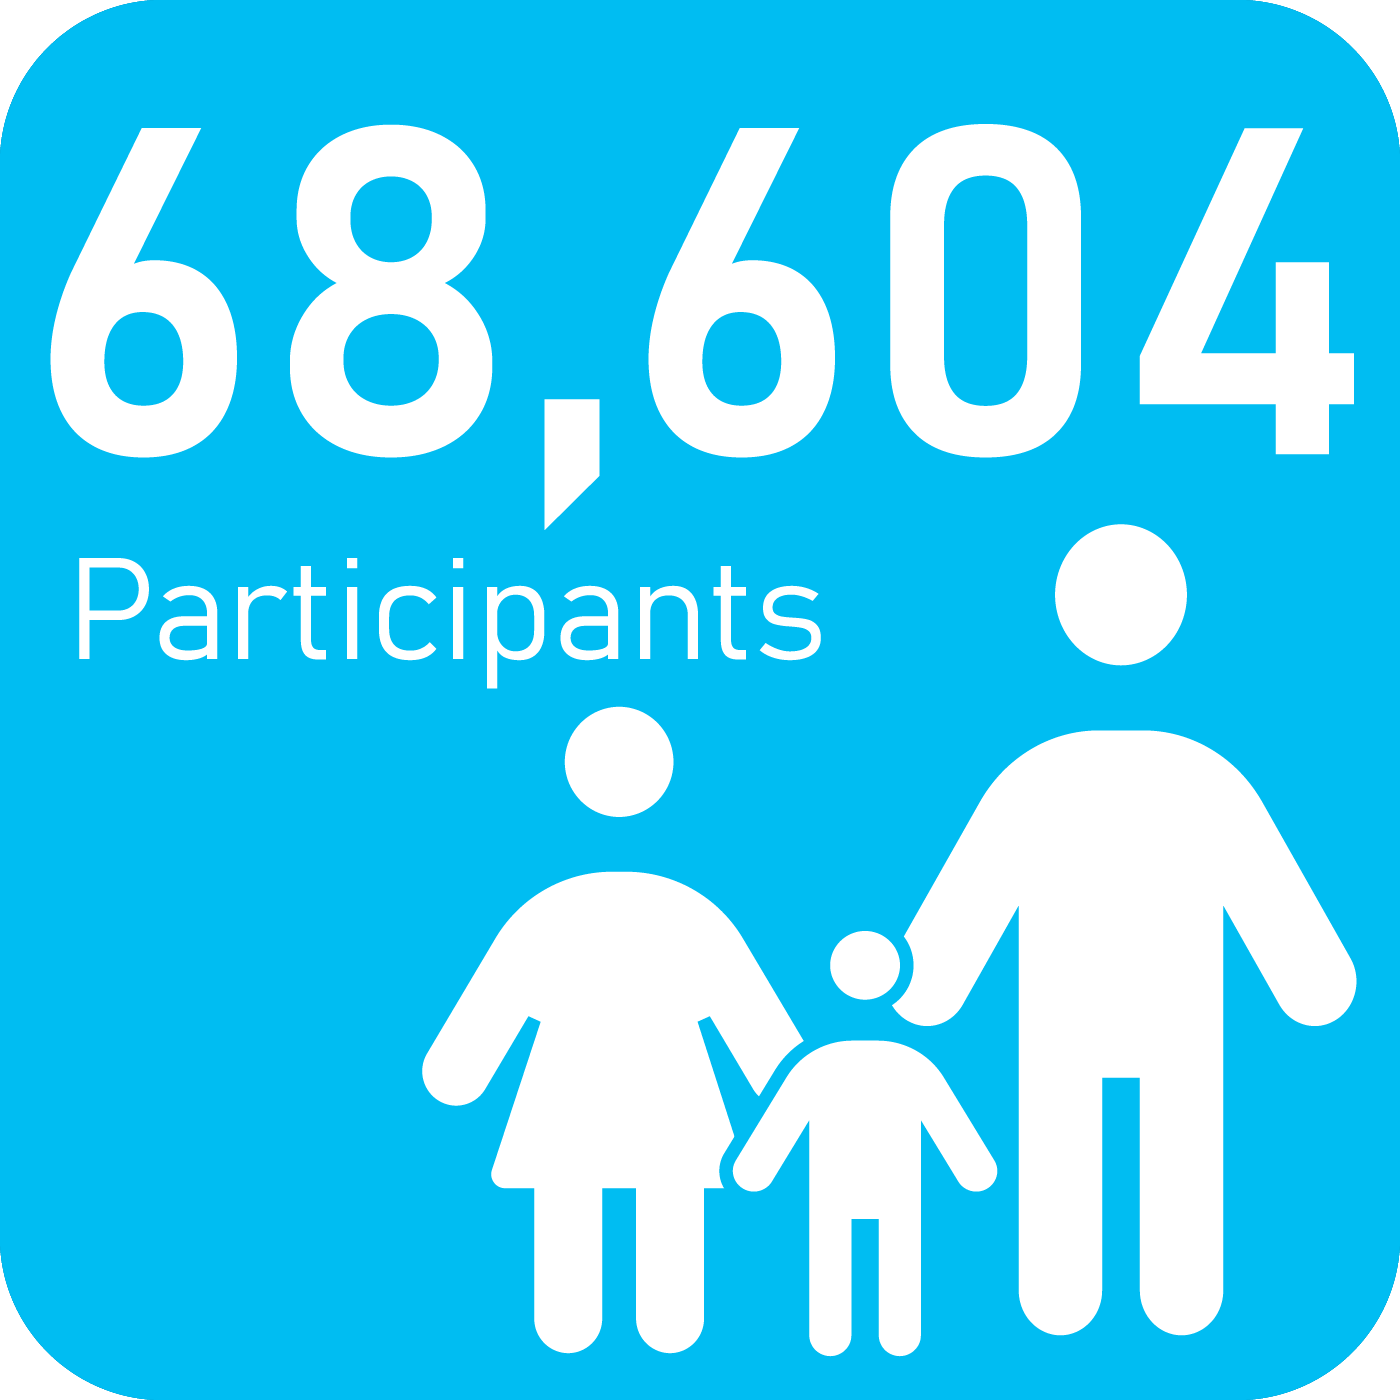
Ruvuma
Percentage of improved toilets
2017
45%
2018
50%
2019
56%
2020
62%
2021
66%
Number of events and attendance


Close

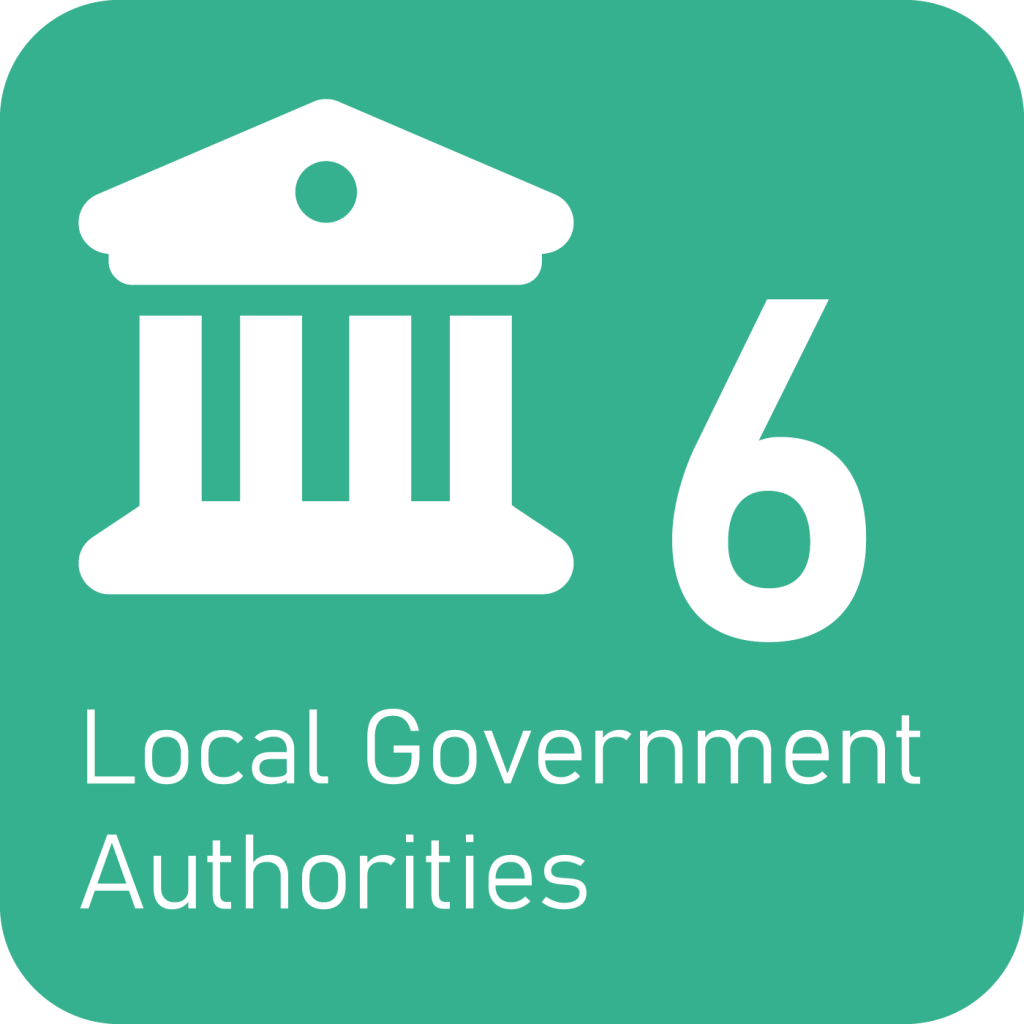
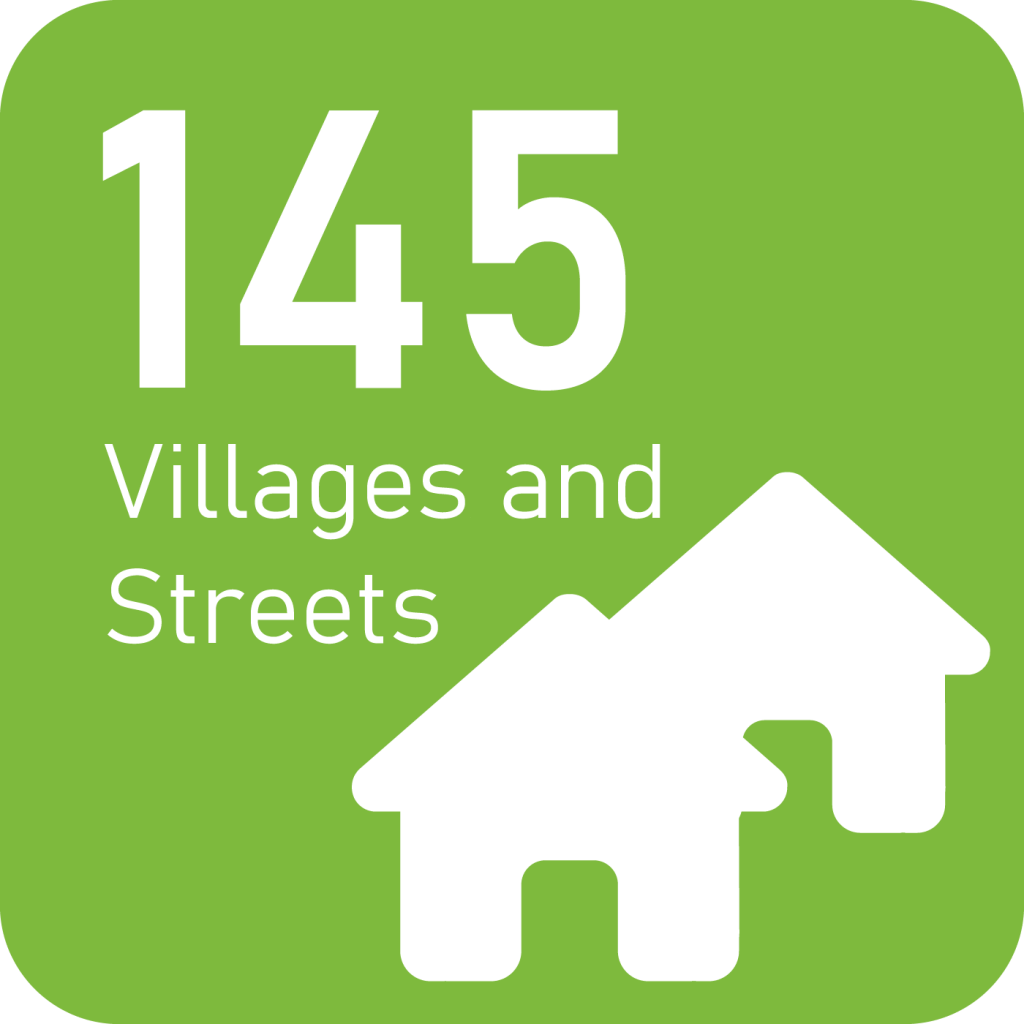
Shinyanga
Percentage of improved toilets
2017
35%
2018
46%
2019
55%
2020
60%
2021
68%
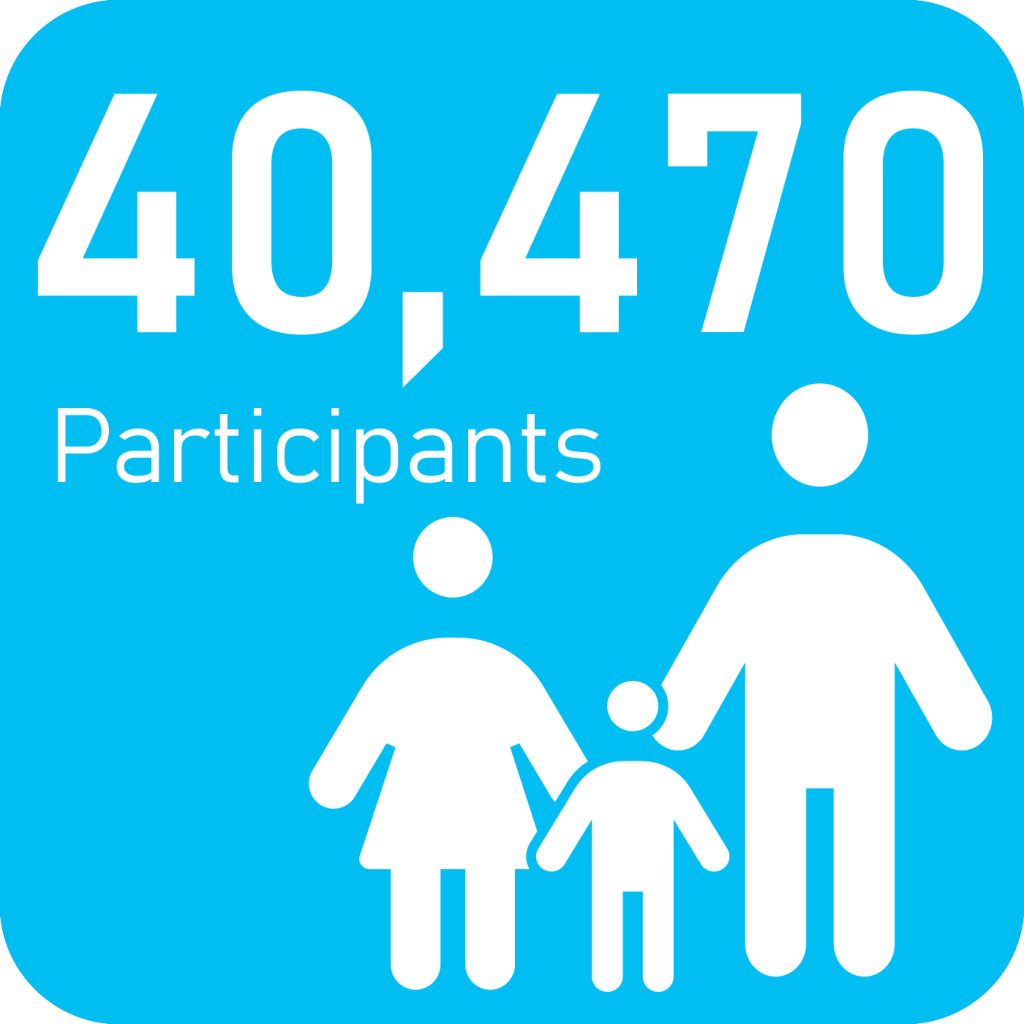
Number of events and attendance


Close

Simiyu
Percentage of improved toilets
2017
50%
2018
47%
2019
48%
2020
60%
2021
64%
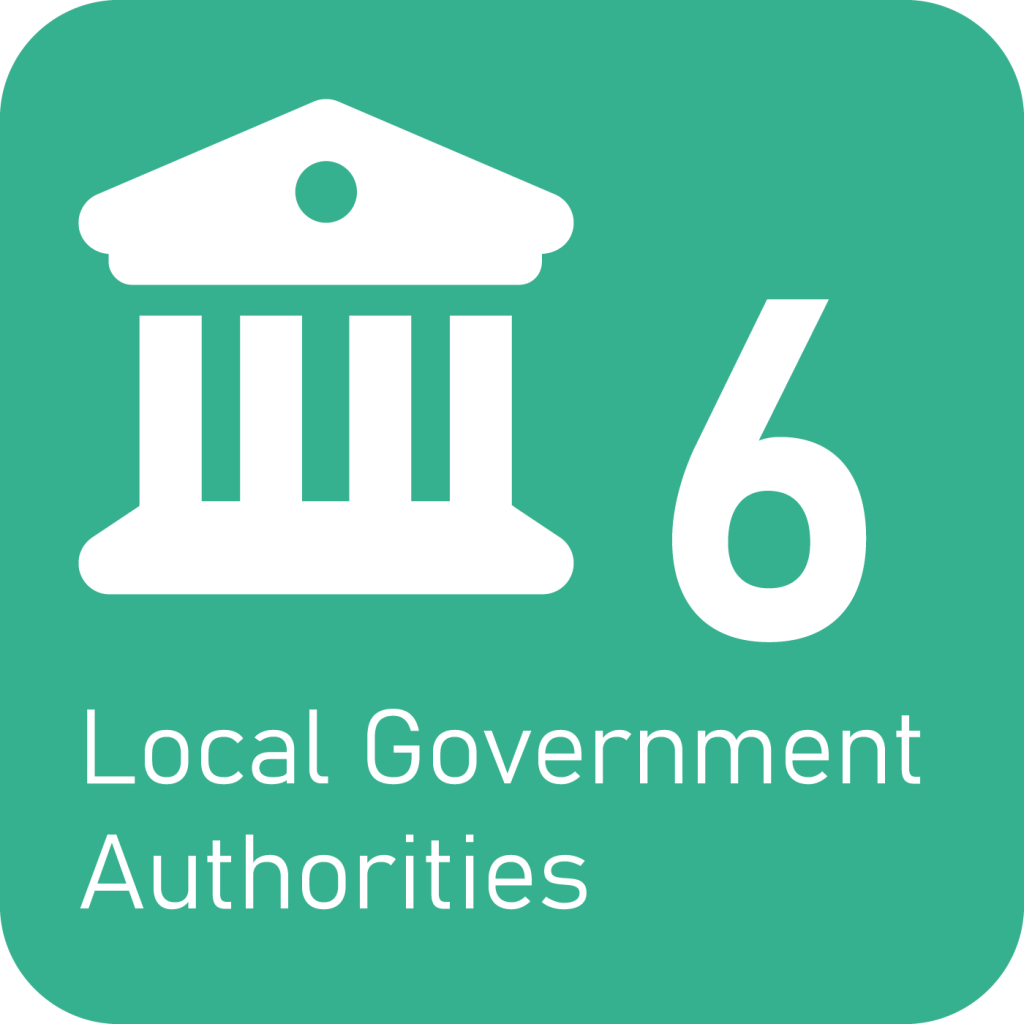
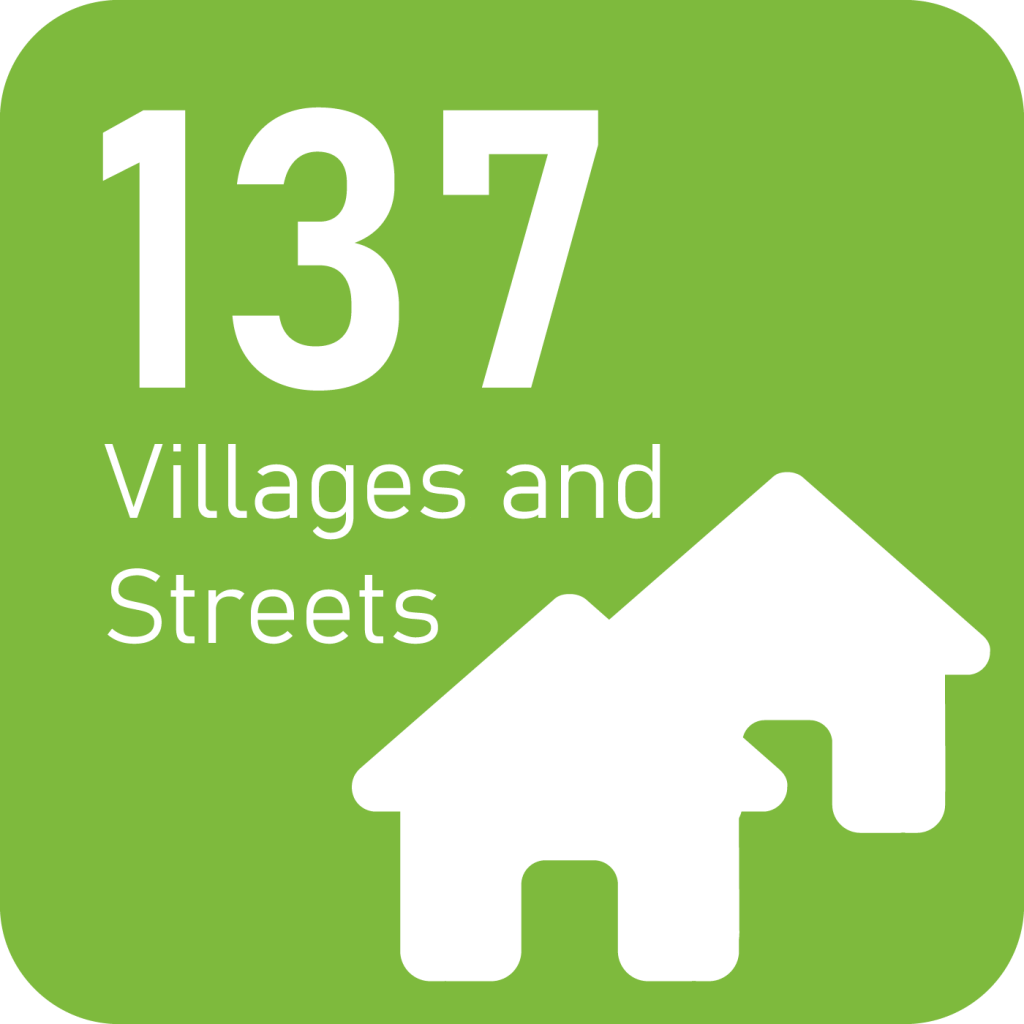
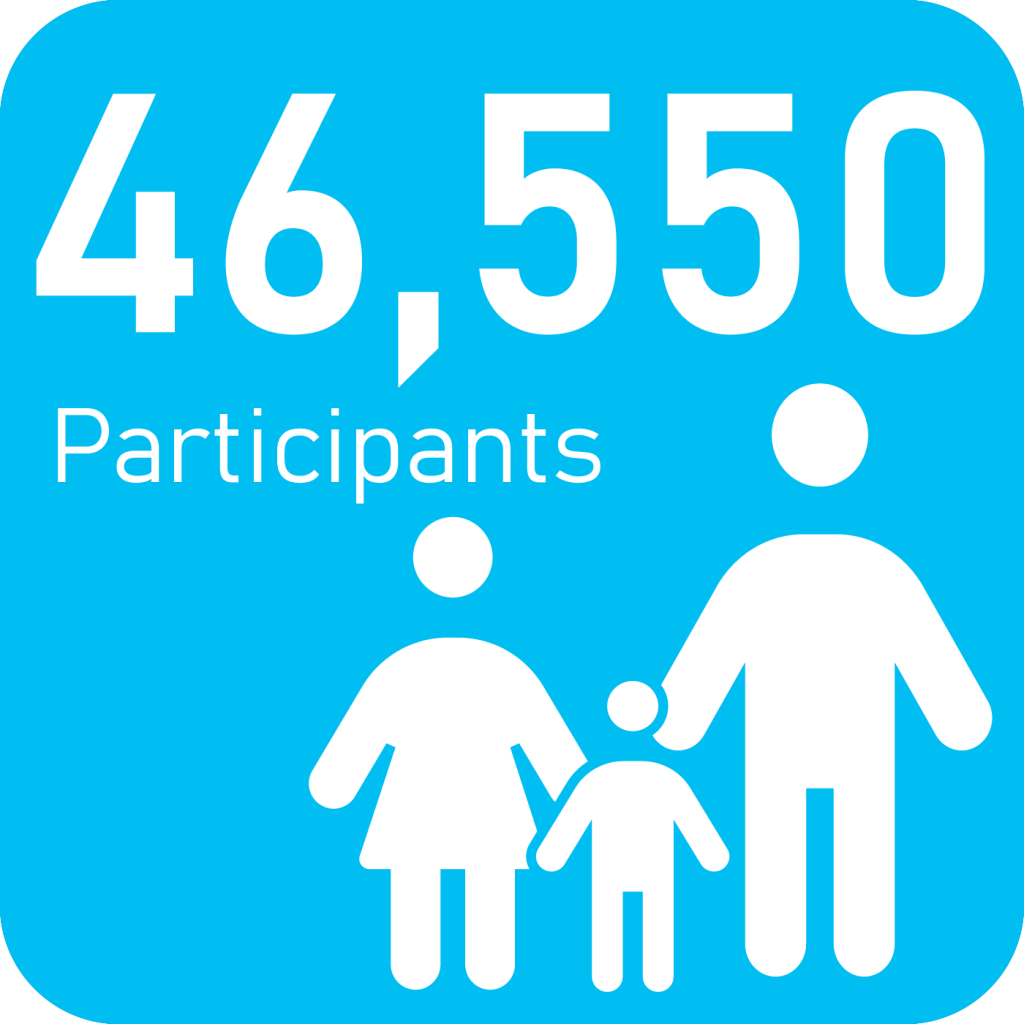
Number of events and attendance


Close

Singida
Percentage of improved toilets
2017
37%
2018
40%
2019
49%
2020
48%
2021
58%
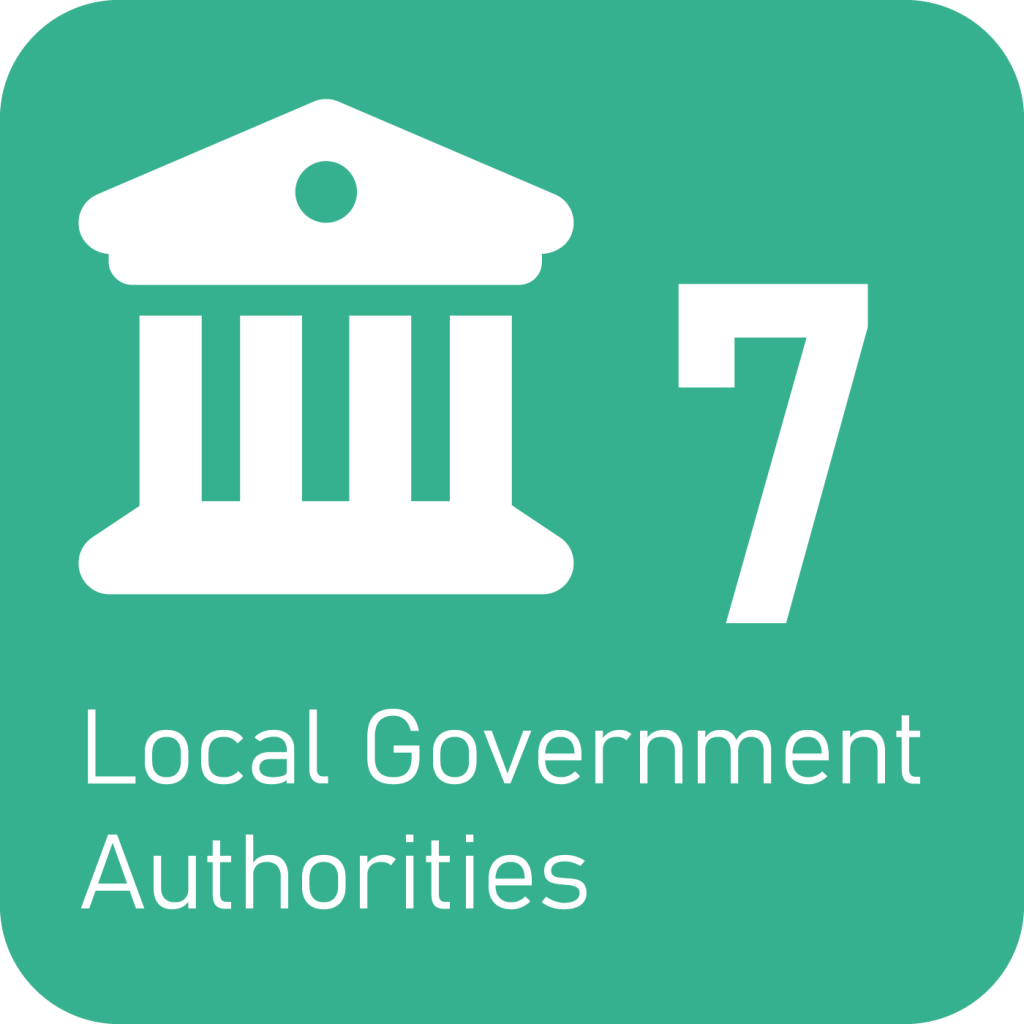
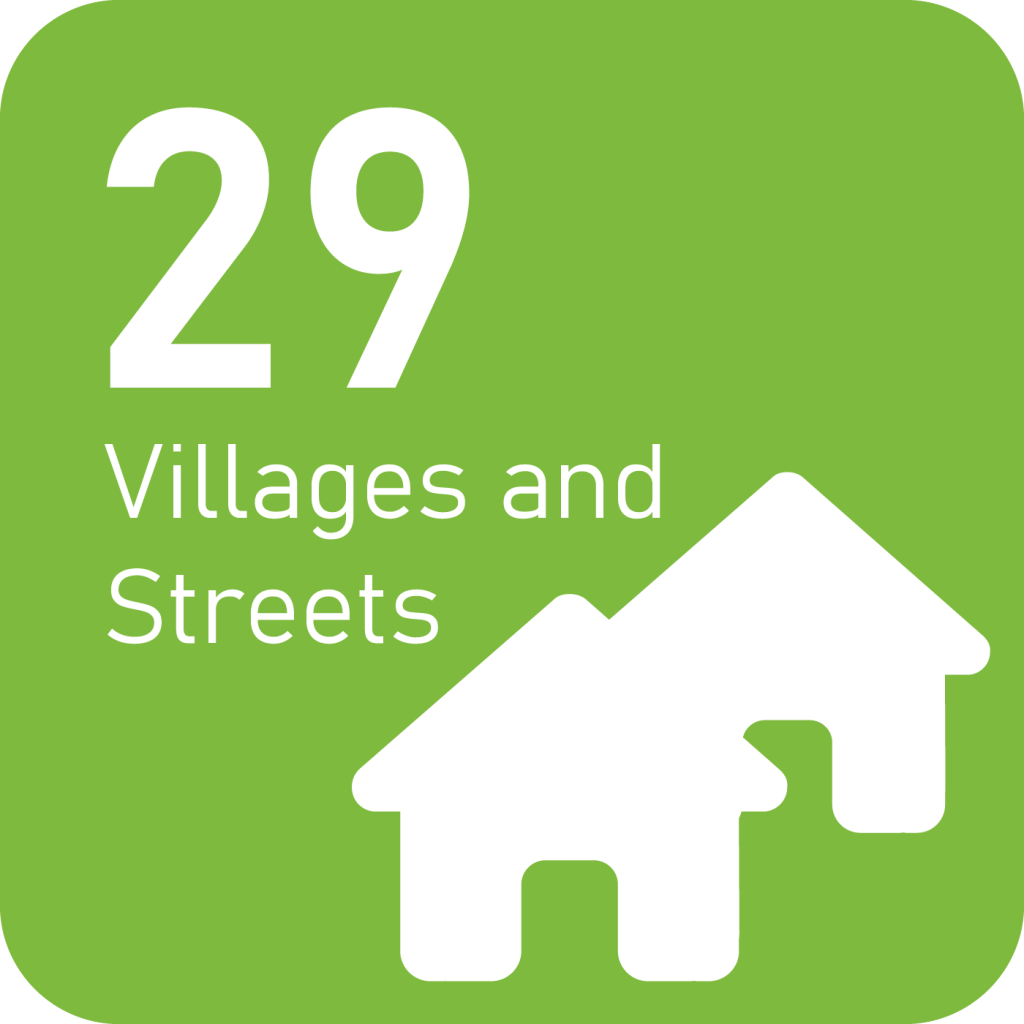
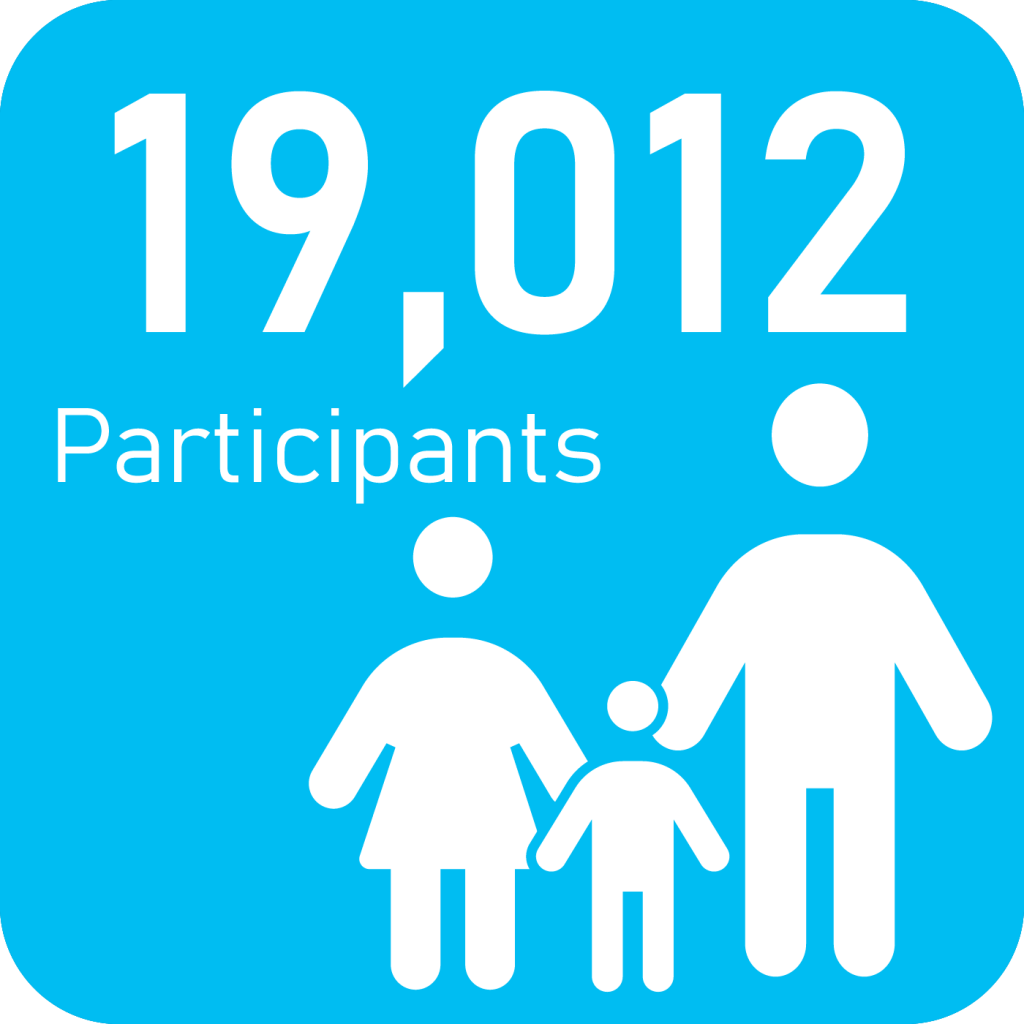
Number of events and attendance


Close

Songwe
Percentage of improved toilets
2017
30%
2018
45%
2019
58%
2020
61%
2021
71%
Number of events and attendance


Close

Tabora
Percentage of improved toilets
2017
28%
2018
42%
2019
55%
2020
63%
2021
70%
Number of events and attendance


Close

Tanga
Percentage of improved toilets
2017
41%
2018
45%
2019
50%
2020
55%
2021
59%
Number of events and attendance


Close

Pwani
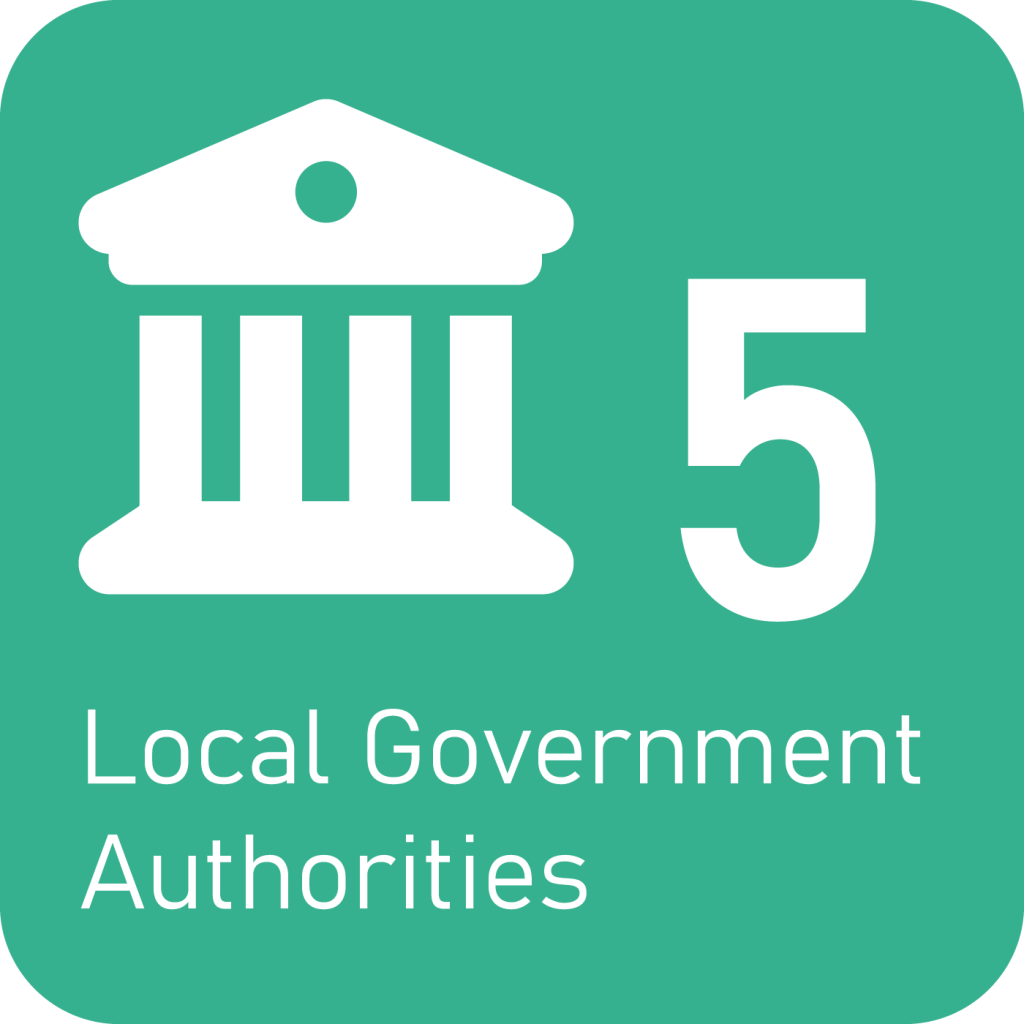
Number of events and attendance


Close

Lindi
Percentage of improved toilets
2017
31%
2018
37%
2019
44%
2020
45%
2021
49%
Number of events and attendance


